Visualizing SPARQL Query Plans with Python and Textualize
Welcome to my little journey of visualizing profiled SPARQL query plans using Python and Textualize ! In this blog post, I’ll walk you through my experience building a text-based user interface (TUI) to bring profiled SPARQL query plans from Stardog to life. But before we dive into the details, let me give you a sneak peek of the final product:
A sneak peek of what I built
All the source code for the project can be found on Github .
The Challenge of Reading Profiled SPARQL Query Plans in Stardog
I have been working at Stardog now for almost 4 years and while I don’t work on the platform’s internals (e.g. the query engine), I have had to interact with query plans numerous times - usually while trying to optimize my poorly written SPARQL queries 😊. Stardog has always been able to produce and surface SPARQL query plans to users and semi-recently added a capability to add profiling information to the query plan to help users reduce and eliminate bottlenecks in their queries. This capability is exposed as part of Stardog’s query plan service, and like many other features, is exposed via an HTTP endpoint , the Stardog’s CLI , and Stardog Studio (an IDE-like experience for interacting with Stardog). This is all good and well, except that the output from the profiler can get pretty verbose and a bit unwieldly to visually inspect.
For example, here’s the abbreviated CLI output from a profiled query.
Profiling results:Query executed in 57934 ms and returned 18362955 result(s)Total used memory: 1.6GPre-execution time: 182 ms (0.3%)Post-processing time: 7270 ms (12.5%)
prefix : <http://api.stardog.com/>prefix rdf: <http://www.w3.org/1999/02/22-rdf-syntax-ns#>prefix rdfs: <http://www.w3.org/2000/01/rdf-schema#>prefix xsd: <http://www.w3.org/2001/XMLSchema#>prefix owl: <http://www.w3.org/2002/07/owl#>prefix stardog: <tag:stardog:api:>
From localFrom named local namedDistinct [#17.7M], memory: {total=1.5G (96.1%)}, results: 18.4M, wall time: 15985 ms (27.6%)`─ Projection(?name1, ?name2) [#17.7M], results: 18.5M, wall time: 2459 ms (4.2%)   `─ Filter(?name1 < ?name2) [#17.7M], results: 18.5M, wall time: 16092 ms (27.8%)      `─ HashJoin(?journal) [#35.4M], memory: {total=22M (1.3%)}, results: 37.4M, wall time: 10467 ms (18.1%)         +─ MergeJoin(?author2) [#390K], results: 391K, wall time: 259 ms (0.4%)         │  +─ Scan[PSOC](?author2, <http://xmlns.com/foaf/0.1/name>, ?name2) [#433K], results: 385K (with gaps), wall time: 233 ms (0.4%)         │  `─ Sort(?author2) [#390K], memory: {total=21M (1.3%)}, results: 391K (with gaps), wall time: 388 ms (0.7%)         │     `─ NaryJoin(?article2) [#390K], results: 391K, wall time: 193 ms (0.3%)         │        +─ Scan[PSOC](?article2, <http://purl.org/dc/elements/1.1/creator>, ?author2) [#898K], results: 395K (with gaps), wall time: 154 ms (0.3%)         │        +─ Scan[PSOC](?article2, <http://swrc.ontoware.org/ontology#journal>, ?journal) [#208K], results: 208K (with gaps), wall time: 84 ms (0.1%)         │        `─ Scan[POSC](?article2, rdf:type, <http://localhost/vocabulary/bench/Article>) [#208K], results: 208K (with gaps), wall time: 97 ms (0.2%)         `─ MergeJoin(?author1) [#390K], results: 391K, wall time: 202 ms (0.3%)            +─ Scan[PSOC](?author1, <http://xmlns.com/foaf/0.1/name>, ?name1) [#433K], results: 385K (with gaps), wall time: 200 ms (0.3%)            `─ Sort(?author1) [#390K], memory: {total=21M (1.3%)}, results: 391K (with gaps), wall time: 447 ms (0.8%)               `─ NaryJoin(?article1) [#390K], results: 391K, wall time: 249 ms (0.4%)                  +─ Scan[PSOC](?article1, <http://purl.org/dc/elements/1.1/creator>, ?author1) [#898K], results: 395K (with gaps), wall time: 221 ms (0.4%)                  +─ Scan[POSC](?article1, rdf:type, <http://localhost/vocabulary/bench/Article>) [#208K], results: 208K (with gaps), wall time: 110 ms (0.2%)                  `─ Scan[PSOC](?article1, <http://swrc.ontoware.org/ontology#journal>, ?journal) [#208K], results: 208K (with gaps), wall time: 128 ms (0.2%)
The Stardog CLI and Stardog Studio by will return the profiled query plan in plain text containing information about the profiled plan, the query profiled, and a tree representing the query plan with profiler information about individual nodes, also known as “operators”.
From the Stardog Docs :
The plan is arranged in a hierarchical, tree-like structure which grows left to right. The nodes, called operators, represent units of data processing during evaluation. They correspond to evaluations of graph patterns or solution modifiers as defined in SPARQL 1.1 specification . All operators can be regarded as functions which may take some data as input and produce some data as output. All input and output data is represented as streams of solutions , that is, sets of bindings of the form
x -> valuewherexis a variable used in the query and value is some RDF term (IRI, blank node, or literal). Examples of operators include scans, joins, filters, unions, etc.
While the text format is packed with useful information, it is unstructured and hard to parse programmatically. The larger the plan is, the harder these get to visually inspect as well. Wouldn’t it be great if we could get the profiled query in some sort of a structured format like JSON so we could potentially make a tool to more easily inspect the plans? Well it turns out the HTTP endpoint can actually return the plan in JSON in addition to plain text!
{ "prefixes": {...}, "profiler": { "memory": "1.1M", "time": "30", "results": "5", "time unit": "ms" }, "dataset": {...}, "plan": { "memory": "256K", "children": [ { "children": [], "time": "0", "label": "Scan[PSOC](?similarMovie, http://www.w3.org/2000/01/rdf-schema#label, ?similarMovieLabel)", "results": "10", "gaps": "true", "cardinality": 29000 }, ...more children ]}Introducing Textualize
For the past couple years, I’ve had a lot of fun building TUIs like jqp and guard-dog . All of my TUIs to date have been built using Go leveraging Charmbracelet’s bubbletea framework , but I’ve been using quite a bit of Python at work and was looking for an excuse to leverage it in additional project. I’d heard interesting things about Textualize , which is a Python library for building TUIs and thought I’d give it a shot in my attempt to better visualize profiled Stardog query plans.
”Rapid Application Development”
Textualize positions itself as a “Rapid Application Development” framework - a point that really resonated with me during the creation of my SPARQL profiler TUI. While there was an initial learning curve grasping Textualize’s framework, once I understood the main concepts, the experience was really remarkable. Working within Python and employing Textual’s CSS-like styles proved to be a real delight. While I hold deep admiration for bubbletea (and everything the Charmbracelet team makes) in my previous TUI endeavors, Textualize not only provides an exceptional developer experience but just being able use Python is a big plus for prototyping (at least for me). This became especially advantageous when dealing with sizable JSON payloads representing profiled SPARQL query plans. While achieving similar results in Go is feasible I’m sure, I found Textualize enabled me to rapidly prototype and implement a functional solution over a weekend of hacking.
What I Built
I developed a SPARQL Profiler TUI to make it easier to inspect and analyze the SPARQL query plans produced by Stardog. I tried to take all that really useful information returned by Stardog and organize it in more navigable and intuitive way.
See the high-level features of the TUI in the sections below.
CLI Entrypoint
I quickly constructed a CLI using click in order to take input from the user to communicate with their Stardog server and launch the TUI. This is the entrypoint. Below is the usage of the CLI:
❯ sparql-profiler -hUsage: sparql-profiler [OPTIONS] [QUERY]
  Profiles the QUERY.
  If both the query_file option and QUERY argument are provided, the QUERY  argument will take precedence.
  If token is provided in addition to a username and password for  authentication, the token will take precedence.
Options:  -u, --username TEXT        Stardog username (applicable only if token not                             provided)  [default: admin]  -p, --password TEXT        Stardog password (applicable only if token not                             provided)  [default: admin]  -t, --token TEXT           Auth JWT token (applicable only if username and                             password are not provided)  -e, --endpoint TEXT        Stardog endpoint  [default:                             http://localhost:5820; required]  -d, --database TEXT        Stardog database  [required]  -r, --reasoning            Enables reasoning for the query to be profiled.  -f, --query_file FILENAME  File containing query to profile  -h, --help                 Show this message and exit.
Foldable Tree-Like User Interface
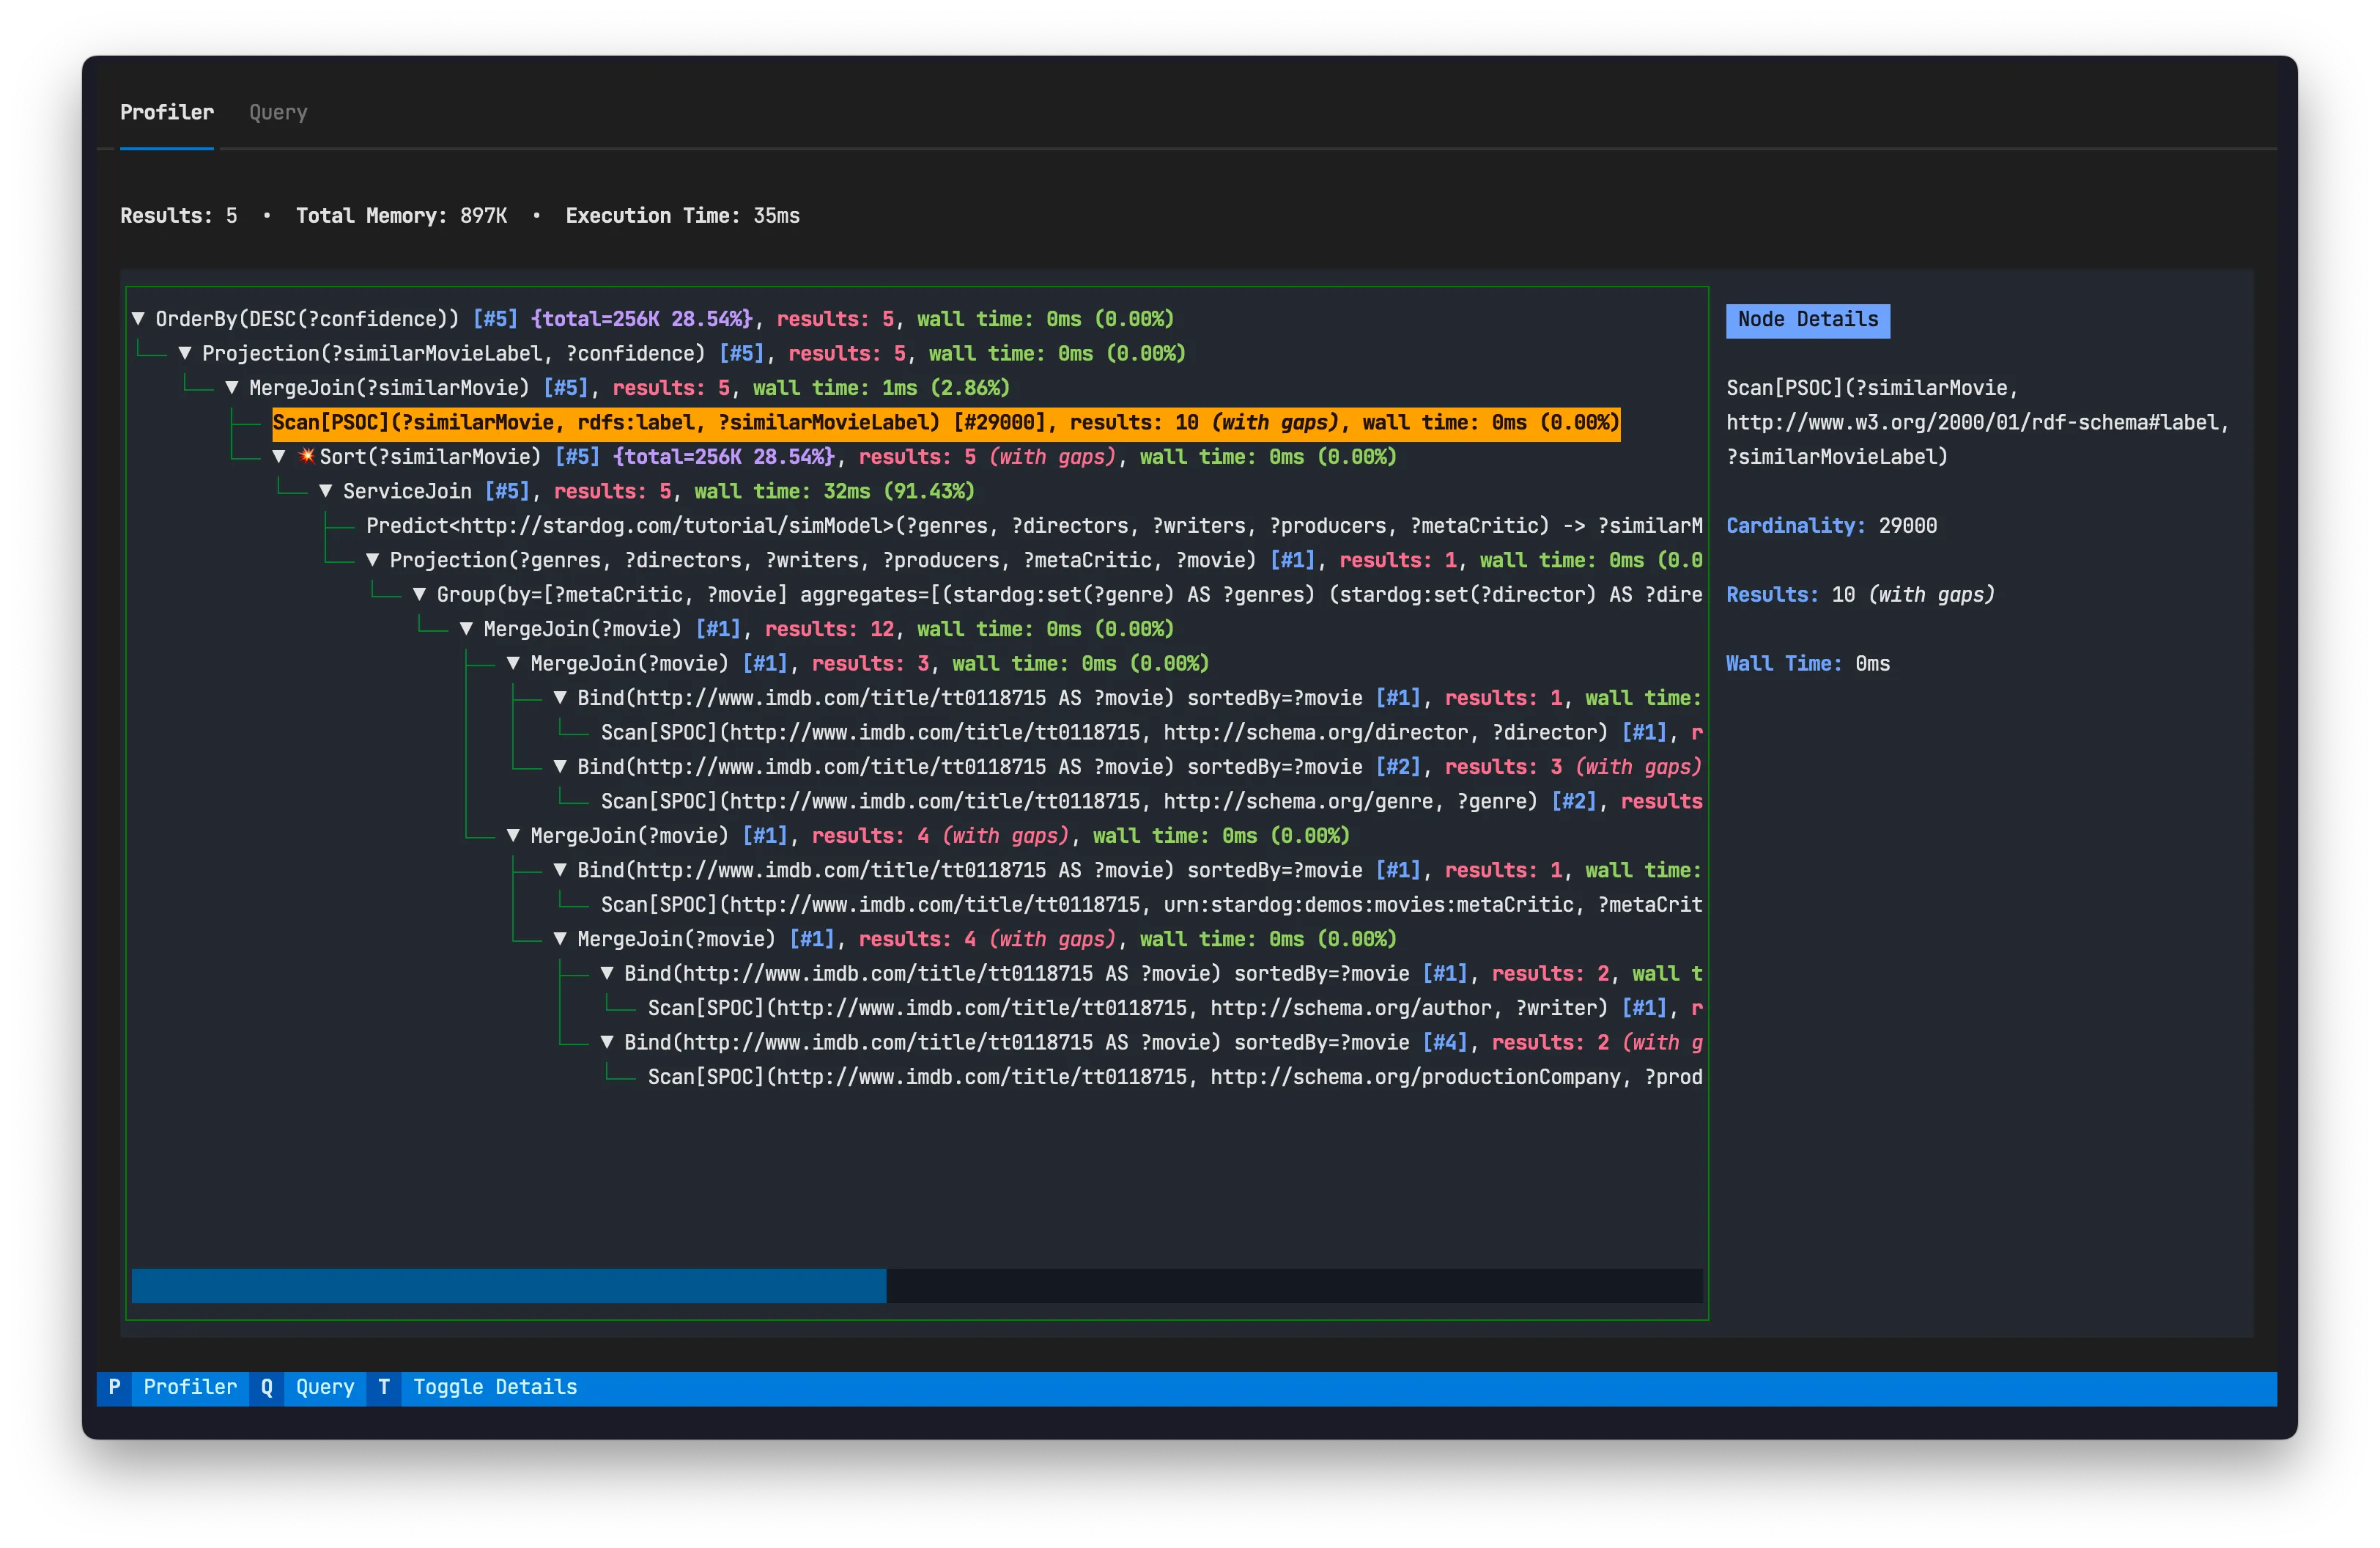
The heart of the profiler TUI is an intuitive, foldable tree-like user interface. Leveraging Textualize’s powerful tree widget , I created a visual representation of the SPARQL query plan. This interface offers users a structured and navigable view of the plan’s hierarchy.
The heavy lifting here perse was transforming the JSON output from Stardog containing the profiler information and query plan into my custom tree widget.
class PlanNode:    def __init__(self, plan_node_dict: dict):        """Initializes a PlanNode object with the provided dict - the plan nodes/operators returned        from Stardog as JSON has a structure like this        """        self._label = plan_node_dict.get("label")        self._cardinality = plan_node_dict.get("cardinality")        self._results = plan_node_dict.get("results")        self._time_ms = plan_node_dict.get("time", "0")        self._memory = plan_node_dict.get("memory")        self._gaps = plan_node_dict.get("gaps", False)        self._children = [            PlanNode(plan_node_dict=child_plan_node)            for child_plan_node in plan_node_dict.get("children", [])        ]
    ...
class PlanNodeTree(Tree[PlanNode]):    """Subclassing Textual's Tree widget    - `PlanNode` is my custom data type to store info about    nodes/plan operators in a query plan    """    def __init__(self, query_plan: dict, namespaces: dict, *args, **kwargs) -> None:        super().__init__(*args, **kwargs)        self.query_plan = query_plan        self.namespaces = namespaces

def build_tree(tree_node: TreeNode | PlanNodeTree, plan_node: PlanNode):    """    Recursively builds a tree structure from a PlanNode object and adds it to the provided tree_node.
    Parameters:    - tree_node (TreeNode or PlanNodeTree): The current node or tree to which the plan_node will be added.    - plan_node (PlanNode): The PlanNode object representing a node in a query plan.    """    if len(plan_node.children) == 0:        if isinstance(tree_node, PlanNodeTree):            tree_node.root.add_leaf(label=plan_node.label, data=plan_node)        else:            tree_node.add_leaf(label=plan_node.label, data=plan_node)        return
for child_plan_node in plan_node.children: if isinstance(tree_node, PlanNodeTree): if len(child_plan_node.children) != 0: tree_node = tree_node.root.add( label=child_plan_node.label, data=child_plan_node, ) build_tree(tree_node=tree_node, plan_node=child_plan_node) else: build_tree(tree_node=tree_node, plan_node=child_plan_node) else: if len(child_plan_node.children) != 0: tree = tree_node.add( label=child_plan_node.label, data=child_plan_node, ) build_tree(tree_node=tree, plan_node=child_plan_node) else: build_tree(tree_node=tree_node, plan_node=child_plan_node)See the full code for the custom widget on Github .
Plan Tree Nodes
Each node in the tree provides essential information for debugging query performance:

- Cardinality Estimations: An estimate of the number of results actually generated. These are contained in square brackets
[]- the same way Stardog displays them in query plans.Info A common cause of suboptimal query plans is cardinality mis-estimations, i.e. when the number of results that the optimizer thought an operator would generate and the actual number of results are several orders of magnitude apart.
- Memory: The amount of allocated managed memory used by a node/plan operator. This is only reported for pipeline-breaking node/plan operators which materialize intermediate results in memory.
- Intermediate Number of Results: The number of intermediate query results generated by each node/ plan operator. The profiler detects when some part of the node/plan operator’s output is skipped over. In this case, “with gaps” is appended to the results.
- Wall time for each plan operator - The time spent on the server evaluating the node/plan operator. The percentage the plan operator uses of the total wall time is also displayed next to the amount of time in parentheses
(). To provide a comprehensive view of wall time when folding section of the tree, the TUI dynamically calculates and displays the total wall time of a node’s children when a parent node is folded.
Here’s a snippet from the source code showcasing the wall time calculation. This is fairly straightward to do in Python.
def sum_wall_time(node: "PlanNode") -> int:  """Utility to sum the wall time of a PlanNode's children"""  if node.num_children == 0:      return 0
  total_time = 0  for child in node.children:      child_time = child.time_ms or 0  # Consider None as 0      total_time += child_time + sum_wall_time(node=child)
  return total_time
Upon folding a parent node, the TUI calculates and displays the wall time of the plan node/operator's children on the parent node's label.
Color-Coded Output for Key Information
To enhance the interpretability of the query plan, I color-coded the label for each node/plan operator. By leveraging Rich (also from Textualize), I applied distinct colors and styles to various elements in the tree view. This approach helps users quickly identify and understand key aspects such as memory usage, cardinality estimations, and more.
Moreover, I prepended a visual indicator (💥) to a node/plan operators label to highlight nodes that serve as pipeline breakers . Identifying these pipeline breakers is crucial for optimizing query performance, as they can have significant implications, often related to memory pressure.
From the Stardog Docs :
Not all operators can produce output solutions as soon as they get first input solutions from their children nodes. Some need to accumulate intermediate results before sending output. Such operators are called pipeline breakers, and they are often the culprits for performance problems, typically resulting from memory pressure. It is important to be able to spot them in the plan since they can suggest either: a) a way to re-formulate the query to help the planner, or b) a way to make the query more precise by specifying extra constants where they matter.
Tabs to Switch Between Query and Profiled Plan
It can be useful to view the original query you profiled with the query plan. Once again, I was able to leverage Textual’s built in widgets to accomplish this. Textual has a Tabbed Content widget which allows you switch between content panes via a row of tabs. You can actually click on the tabs to switch between tabs or use the keyboard shortcuts displayed in the footer to do so.
The footer is yet another built-in widget. It’s like the control center for all your Textual bindings, neatly displaying all the bindings you’ve set up in your app. All you’ve got to do to setup bindings is utilize the “magic” BINDINGS attribute in your Textual App and/or widget and define some actions for those key bindings.
from textual.app import App
class ProfilerApp(App):    CSS_PATH = "app.css"
    def __init__(        self,        auth: httpx.Auth,        endpoint: str,        database: str,        reasoning: bool,        query: str,    ):        self._auth = auth        self._endpoint = endpoint        self._database = database        self._reasoning = reasoning        self._query = query        super().__init__()
    BINDINGS = [        ("p", "show_tab('profiler')", "Profiler"),        ("q", "show_tab('query')", "Query"),    ]...
def action_show_tab(self, tab: str) -> None:    """Switch to a new tab."""    self.get_child_by_type(TabbedContent).active = tab
    # this is needed to get the bindings to show correctly in footer when on profiler tab    if tab == "profiler":        self.get_widget_by_id("plan_node_tree").focus()
Details Panels
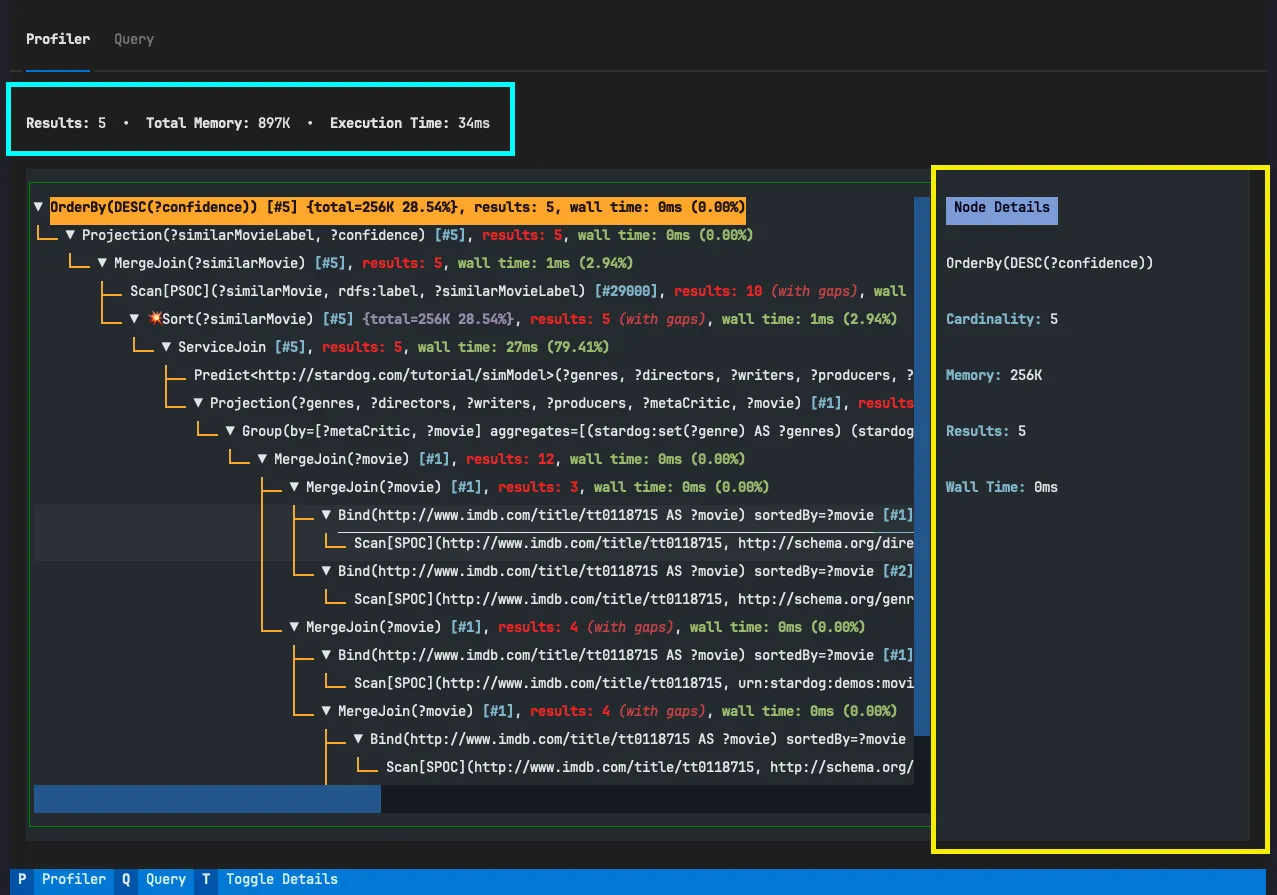
High-Level Profiler Information Panel
The TUI primarily focuses on the tree widget for navigating the query plan. However, I also added a panel that sits right above the tree widget displaying high level profiler information. This panel provides users with a concise overview of the query execution, displaying key performance metrics such as memory usage, execution time, and the number of results returned. The information is extracted from the JSON payload returned by Stardog, specifically from the profiler top level key.
{ "prefixes": {...}, "profiler": { "memory": "897K", "time": "34", "results": "5", "time unit": "ms" }, "dataset": {...}, "plan": {}}Plan Node Details Panel
The foldable tree-like user interface provides a comprehensive visual representation of the entire query execution flow, showcasing detailed information about each node. However, due to its expansive nature, it may occupy a substantial amount of horizontal space.
To address this, you can utilize the Plan Node Details Panel, which offers a more focused view. This panel can be toggled to hide or show, allowing you to concentrate specifically on the details of the highlighted tree node. This proves especially beneficial when node labels extend beyond the visible area, requiring horizontal scrolling to explore the complete content of the tree.
class ProfilerPanel(Widget):    BINDINGS = [("t", "show_node_details()", "Toggle Details")]
    ...
@on(PlanNodeTree.NodeHighlighted) def handle_plan_node_tree_node_highlighted( self, event: PlanNodeTree.NodeHighlighted[PlanNode] ): """Handles what to do each time a node in the tree is highlighted. """ details = self.query_one(PlanNodeDetails) details.node = event.node.data I was able to just add a message
handler such that when a tree node is
highlighted (in focus) the “Node Details” panel (PlanNodeDetails widget) is
updated displaying the node information.
Takeaways
In tackling this project, I discovered that Textualize proved to be an excellent library for what I set out to build. Its abundance of built-in widgets simplifies the initial stages of app composition, while its flexibility allows for the relatively straightforward creation of custom widgets. While I wouldn’t categorize this project as entirely production-ready, it only demanded a weekend’s worth of effort to achieve useful functionality. For those well-versed in Python, averse to dealing with frontend complexities, and inclined towards constructing command-line tools, Textualize comes highly recommended from me.